Intro to Sitecore Search Analytics
This blog covers how to use the Customer Engagement Console (CEC) in Sitecore Search to access and interpret key performance metrics, widgets, and keyword reports
This blog covers how to use the Customer Engagement Console (CEC) in Sitecore Search to access and interpret key performance metrics, widgets, and keyword reports
Start typing to search...
The Analytics section of the Customer Engagement Console (CEC) in Sitecore Search offers a suite of reporting tools designed to enhance your understanding of search performance. These reports provide actionable insights across various metrics, ranging from high-level performance data to granular details about domains, widgets, keywords, and content items.
By effectively tracking user interactions—such as searches, visits, views, clicks, and conversions—Sitecore captures valuable engagement patterns that inform your search implementation strategy. In this blog, we will explore the reporting capabilities within Sitecore Search Analytics, equipping you with the knowledge to optimize your website’s search functionality.
Understanding visitor interactions is crucial for optimizing your site. Each time a visitor engages with a widget, performs a search, adds an item to their cart, or completes a conversion, Sitecore Search captures that event. This comprehensive tracking spans various domains, widgets, pages, search keywords, and product categories, providing insights into user behavior and revealing how effectively your search functionality meets their needs.
Sitecore Search employs a multi-touch attribution model to analyze user interactions over a 30-minute inactivity window, helping to determine how different features contribute to visitor actions. The attribution types include:
These metrics and attribution models are essential for assessing user engagement and refining the search experience, ultimately enhancing user satisfaction and driving conversions.
Metrics and key performance indicators (KPIs) are crucial for analyzing user interactions with your website. They provide insights into how effectively your search functionality engages users and drives conversions. To set the stage, I’ve included some key metrics used in Sitecore Search Analytics, along with their definitions:
| Metric / KPI | Definition |
|---|---|
| Assisted Conversion | Converted items that the visitor clicked or viewed. |
| Average Click Position | Average index of items clicked in a widget. |
| Bookmarks | Items that the visitor bookmarked within a session. |
| Click Conversion | Converted items that were not clicked by the visitor during their session. |
| Click-assisted Conversion Rate (CVR) | Ratio of click-assisted converted visits to total visits. |
| Clicks | Total number of clicks recorded during visitor sessions. |
| Click-through Rate (CTR) | Ratio of unique widget clicks to unique widget views. |
| Content Clicks | Number of items clicked by a visitor during a session or visit. |
| Conversion Rate (CVR) | Ratio of visits that resulted in purchases to the total number of visits. |
| Direct Click Conversions | Number of conversions for items that were clicked in a session or visit. |
| Downloads | Number of items downloaded by the visitor within a session. |
| Null Searches | Searches that returned no results. |
| Searches | Total number of times a visitor initiated a search. |
| Unique Searches | Count of unique keyword searches performed during visitor sessions. |
| Visits | Total number of visits recorded on the site. |
| Widget Clicks | Total number of times visitors clicked on a widget. |
These metrics help you evaluate user behavior, identify trends, and make informed decisions to enhance the overall search experience on your site. You can find a longer and more comprehensive list in the Sitecore Search documentation, here.
Navigating the Analytics tab within the CEC gives you access to a variety of reports that are essential for understanding your site's performance. Each report type offers a unique perspective on your data, enabling effective monitoring and analysis of your search implementation.
The following table summarizes the different types of reports available in Sitecore Search Analytics, along with their descriptions and key features for in-depth analysis:
| Report Type | Description | Key Features |
|---|---|---|
| Comparative Metrics Report | Displays current metrics and line charts comparing up to two metrics over a selected time period. |
|
| Tabular Reports | Presents data in a sortable and filterable table format for detailed examination. |
|
| Donut and Pie Charts | Shows individual item contributions to overall metrics. |
|
| Line Charts | Displays a series of data points over time, illustrating trends. |
|
| Bar Charts | Compares data points across different items or time periods. |
|
| Funnel Reports | Illustrates the progression of a metric through various stages. |
|
| Geo Reports | Maps data distribution across geographical locations. |
|
The Analytics tab of the CEC also gives you access to a variety of reports that provide valuable insights into different aspects of your site’s performance. These reports are categorized into several types, including Widgets, Keywords, Content, and Sources.
Let’s explore these reports in more detail, but first, we should address the Site Performance report.
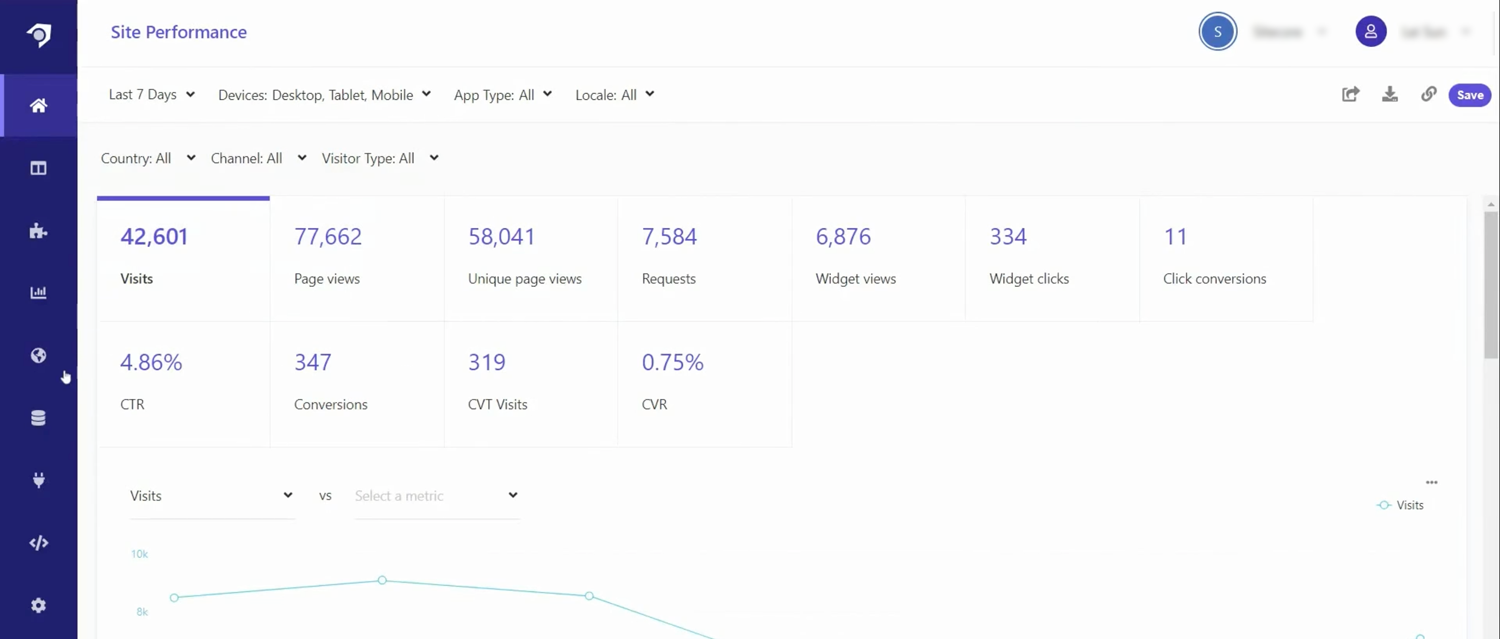
The first report worth mentioning is the full-page Site Performance report. It can be found on the home page of the CEC dashboard in Sitecore Search. This valuable reporting tool provides insights into your website's performance and offers essential analytics data right as you open your CEC. This puts valuable data at your fingertips, making it easy to assess and improve your site's effectiveness. With easy access to performance metrics, you can make informed decisions that enhance your website's functionality and user experience.
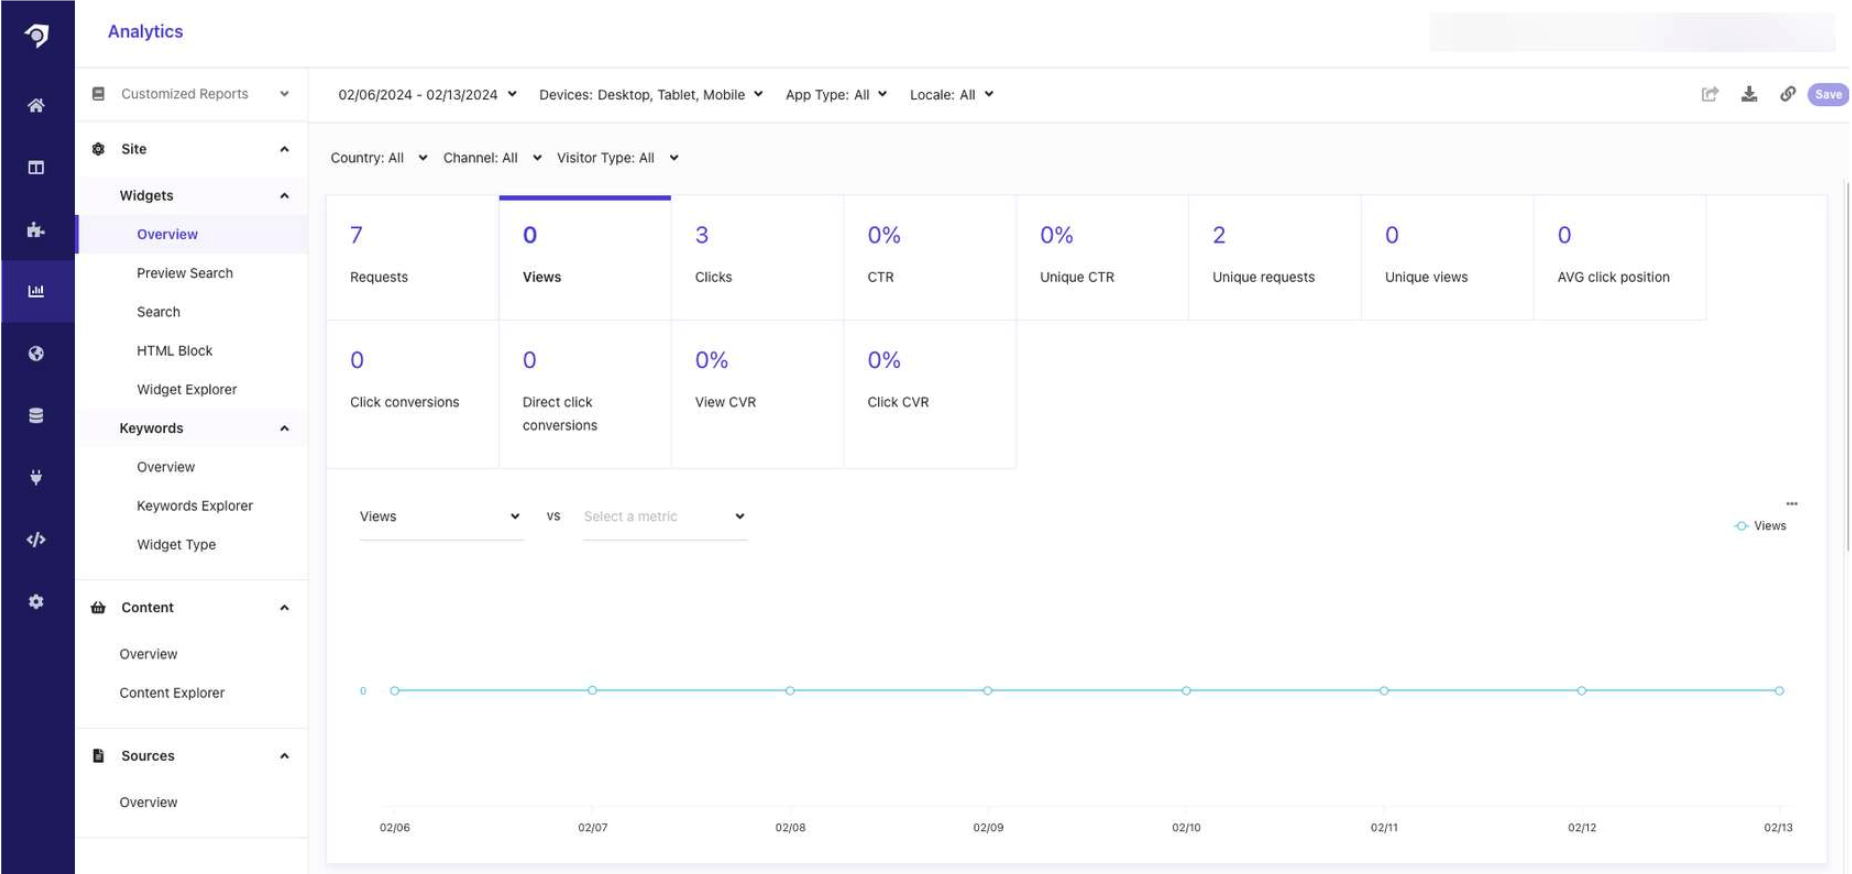
The Widgets reporting section provides comprehensive insights into the performance, engagement, and keywords of your website's widgets. These reports only reflect widgets that were active during your selected time period. You can choose to view an overview of your widgets' performance, analyze specific widget types, or use the Widget Explorer to select and view the performance of individual content items, applying additional filters as needed.
You can filter widget reports by:
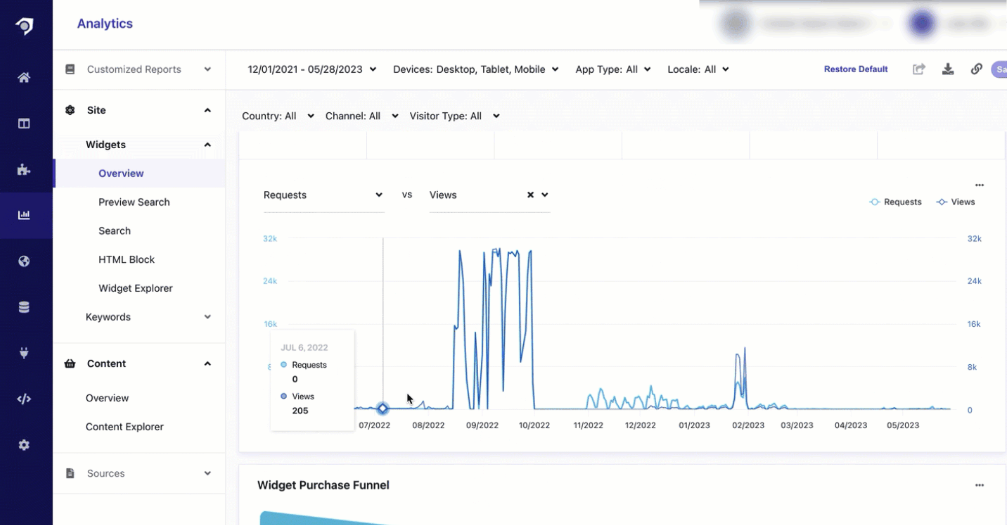
In the Widget Overview, you gain a high-level view of overall widget performance over a specified timeframe. This report displays various metrics through performance cards, graphical representations of comparative metrics, and the widget purchase funnel.
Key metrics in the Widget Overview include:
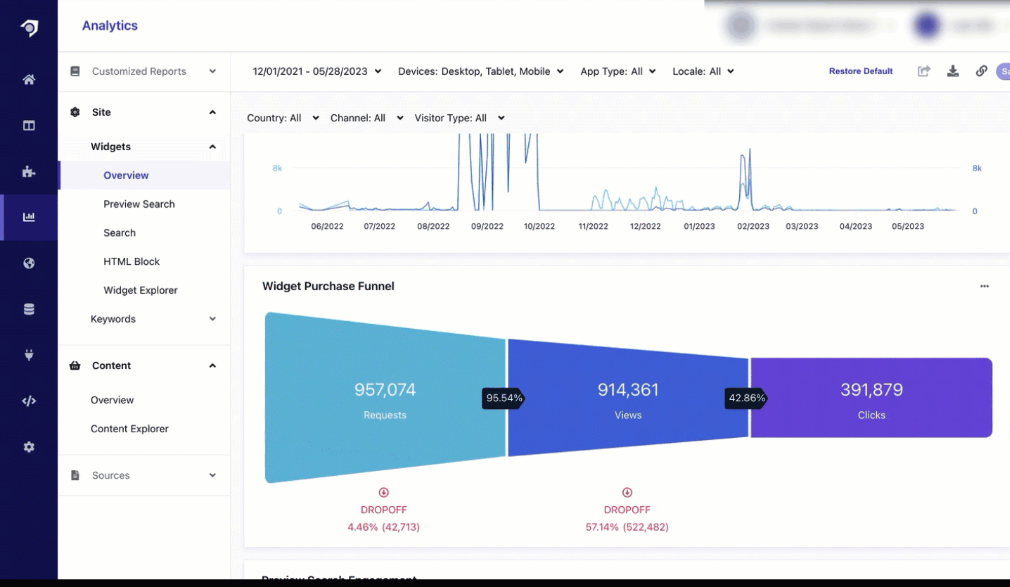
The purchase funnel report summarizes the progression of widget-related metrics, including views, clicks, click-through orders, and direct orders, represented in distinct colored segments. It also highlights drop-off percentages and values throughout the funnel stages.
Additionally, you can view metrics related to Preview Search and Search Page Engagement.
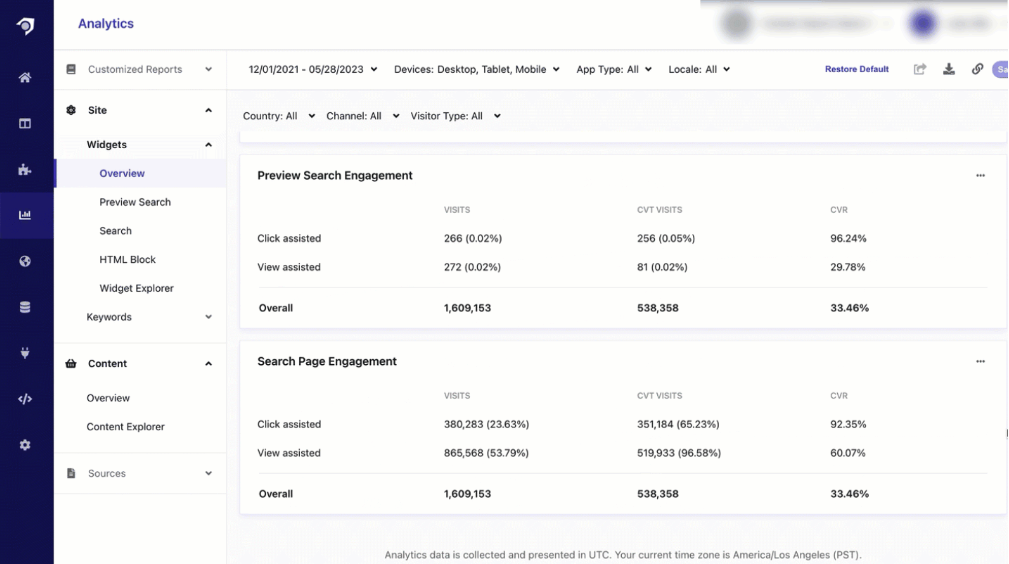
Under the Overview tab, you can access individual widget reports for Preview Search, Search, and HTML Block widgets. These reports provide the same performance cards and graphical representations of comparative metrics as in the Widget Overview, but they are tailored to the individual widget type. You can also apply all the same filters available in the overview.
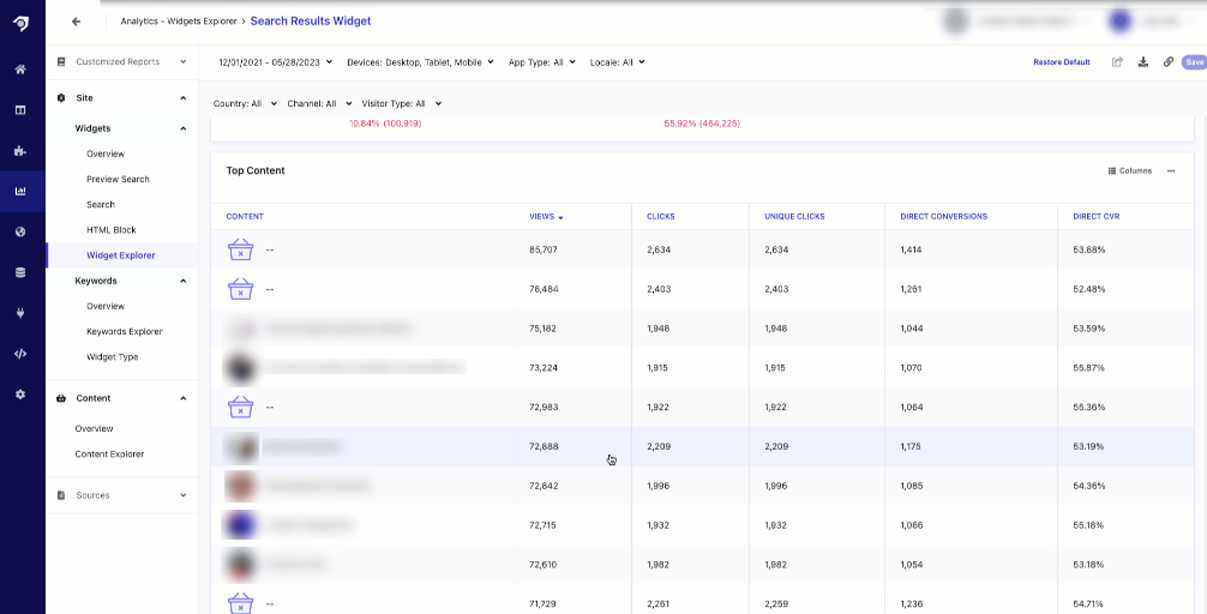
The Widget Explorer report is presented as a paginated table displaying widgets and their recorded metrics over a specified time period. From each widget, you can drill down into a detailed report that includes the same metrics and filters as the other widget reports. When drilling down to a specific widget, you can also view the Top Content and Key Performance Indicators (KPIs) per Variation, providing further insights into widget performance and engagement.
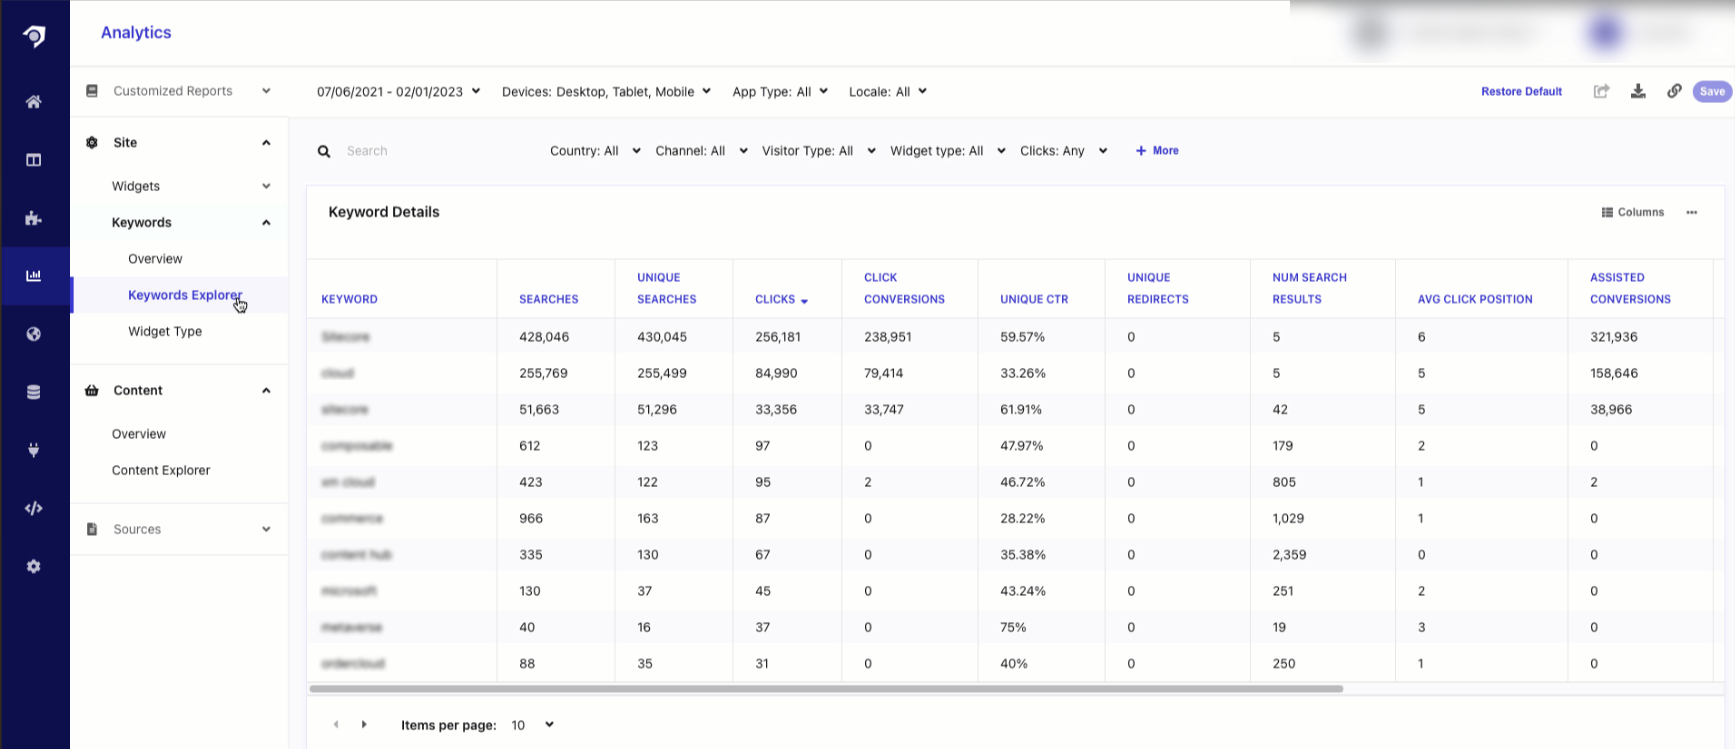
The Keyword Explorer report offers a detailed view of all keywords and their associated metrics recorded over a selected time period. Presented in a paginated table format, this report allows users to navigate easily through the extensive list of keywords. Similar to the Widget Explorer, each row in the table enables users to drill down into detailed reports for individual keywords, facilitating deeper analysis of keyword performance and engagement. The structure and functionality of the Keyword Explorer align with other explorer reports, providing a user-friendly interface for exploring keyword-related metrics.
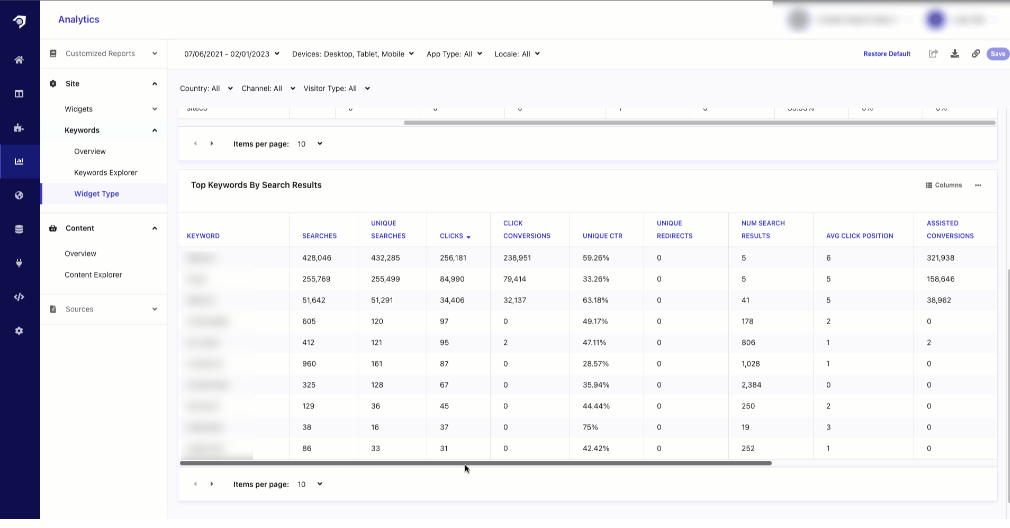
The Keyword Performance by Widget Type report lists performance metrics for keywords used by visitors across different widget types. This report can be filtered based on selected values at the top of the section or within the containing report, providing flexibility in your analysis. There are two specific reports you can drill down into:
The Analytics tab in the CEC provides access to reports on the performance of your search implementation, configuration, searchable content, and overall search functionality. Sitecore Search tracks visitor actions across your entire platform—encompassing pages, widgets, and search keywords—as long as event calls are properly integrated across your site. These actions generate the metrics reports found in the Analytics section.
In the context of content analytics, reports allow you to view an overview of your content's performance or use the Content Explorer to analyze specific content items with additional filtering options.
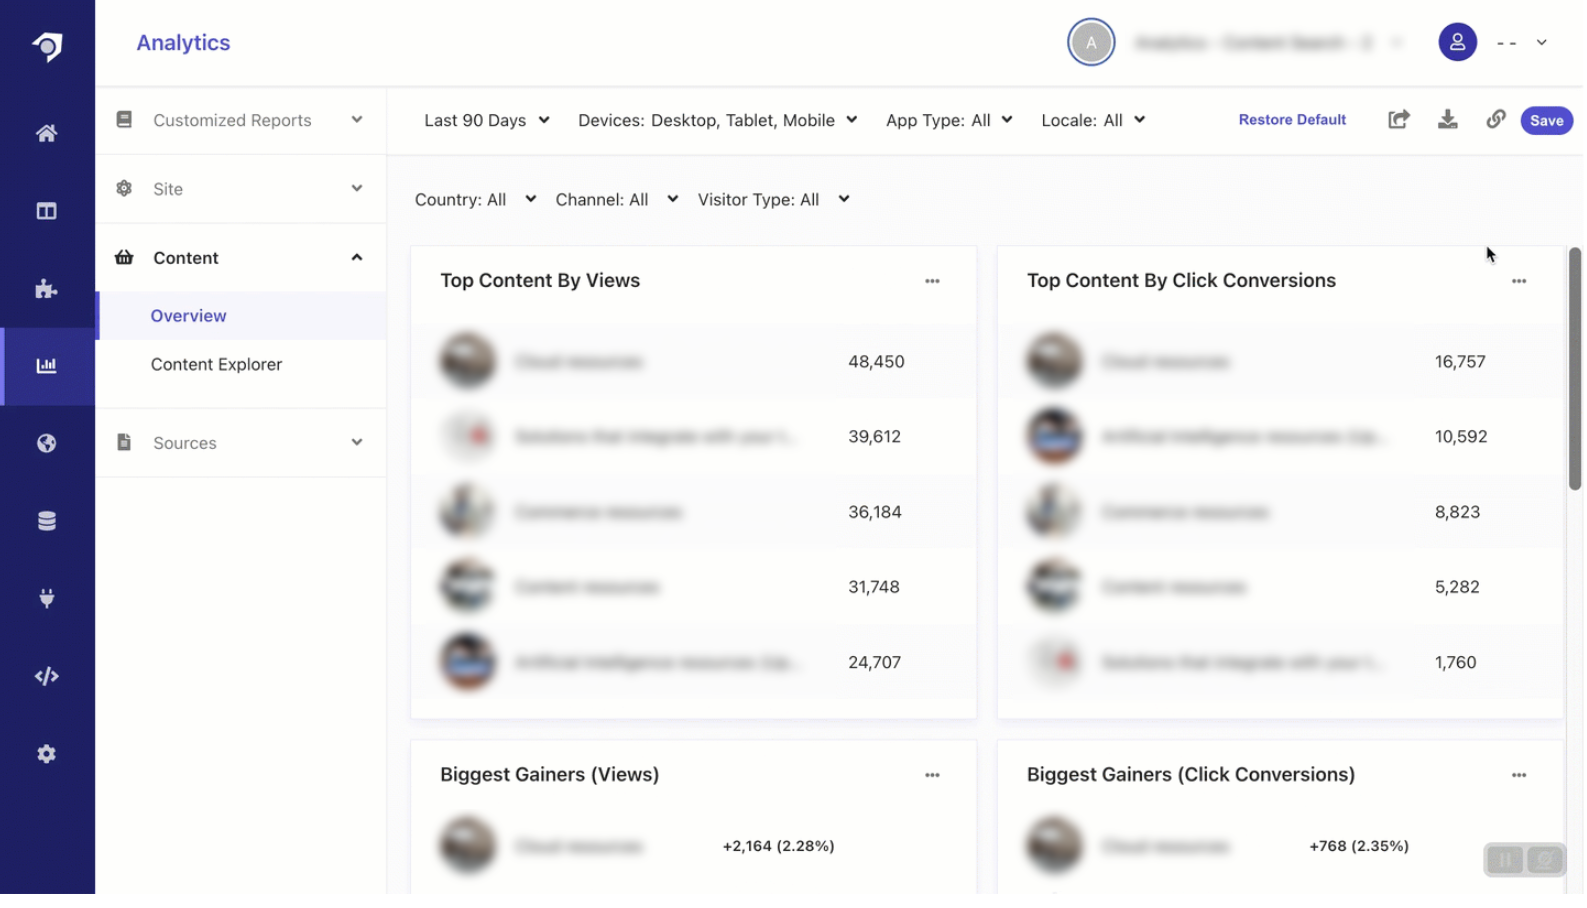
The data displayed in content performance reports can be filtered based on various parameters. The filters are available in the drop-down menus at the top of each report, and changing a filter value will regenerate the content report with updated data. Some of the available filters include:
Note: All analytics reports come pre-filtered for desktop, tablet, and mobile device types. If an analytics page appears empty, check to see if unchecking all filters reveals data.
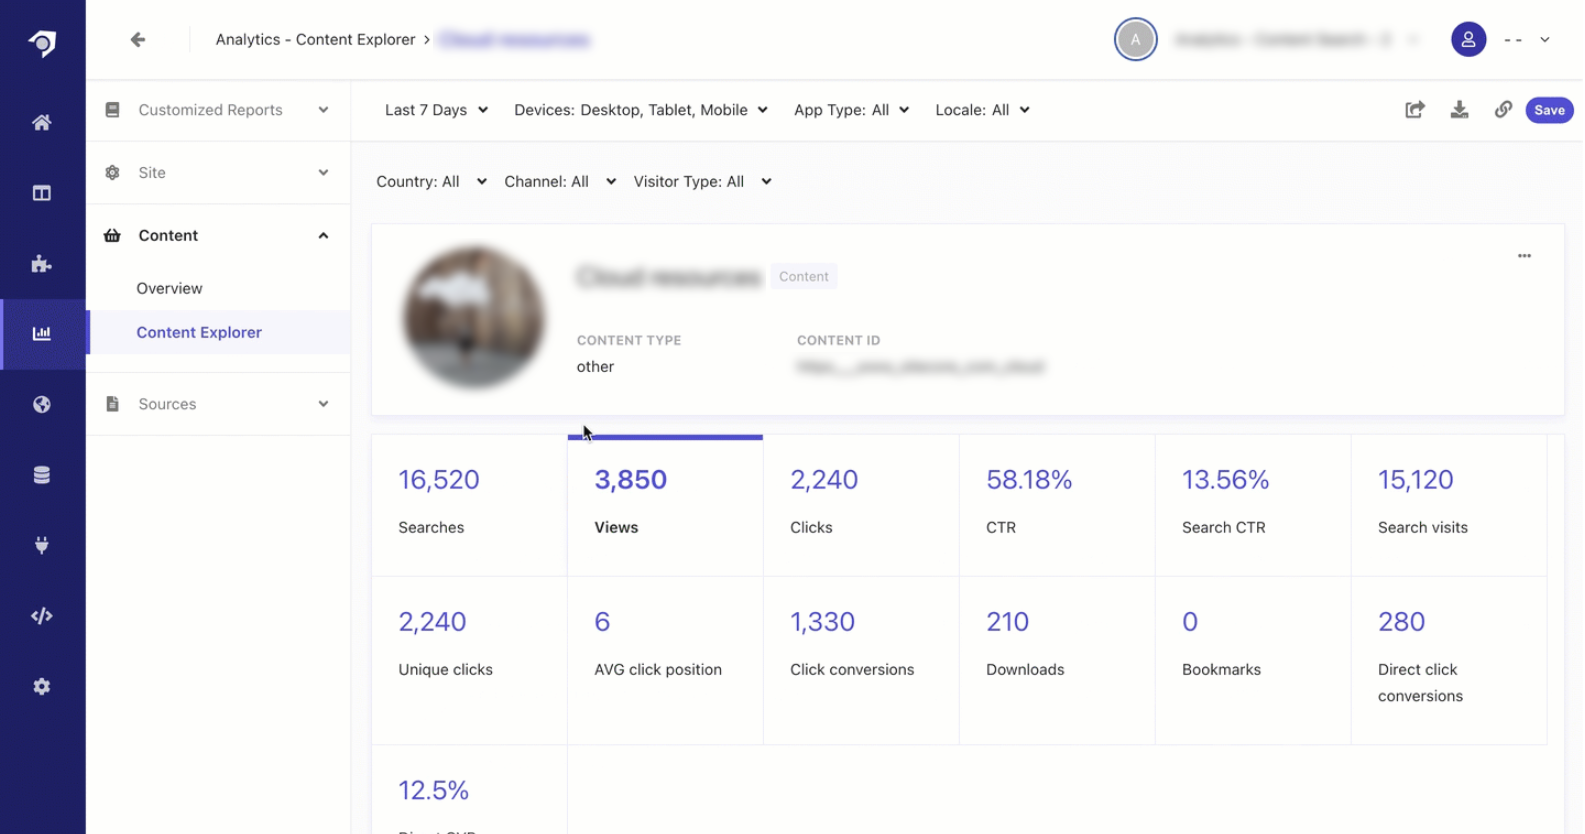
The Content Explorer report displays content items in a list format, with columns dedicated to each metric. You can click on a specific content item to view and compare its metrics in detail.
With the Content Explorer, you can apply further parameters to filters to locate specific content items. For example, you can select a metric such as views and set criteria to find items with views that are equal to, greater than, or less than a specified value. You can also search for content items by keyword.
In Sitecore Search, sources (or connectors) define the content you want to index to ensure relevant search results. The Sources Overview Report allows you to compare key metrics across different sources, providing insights into the effectiveness of your indexing strategy.
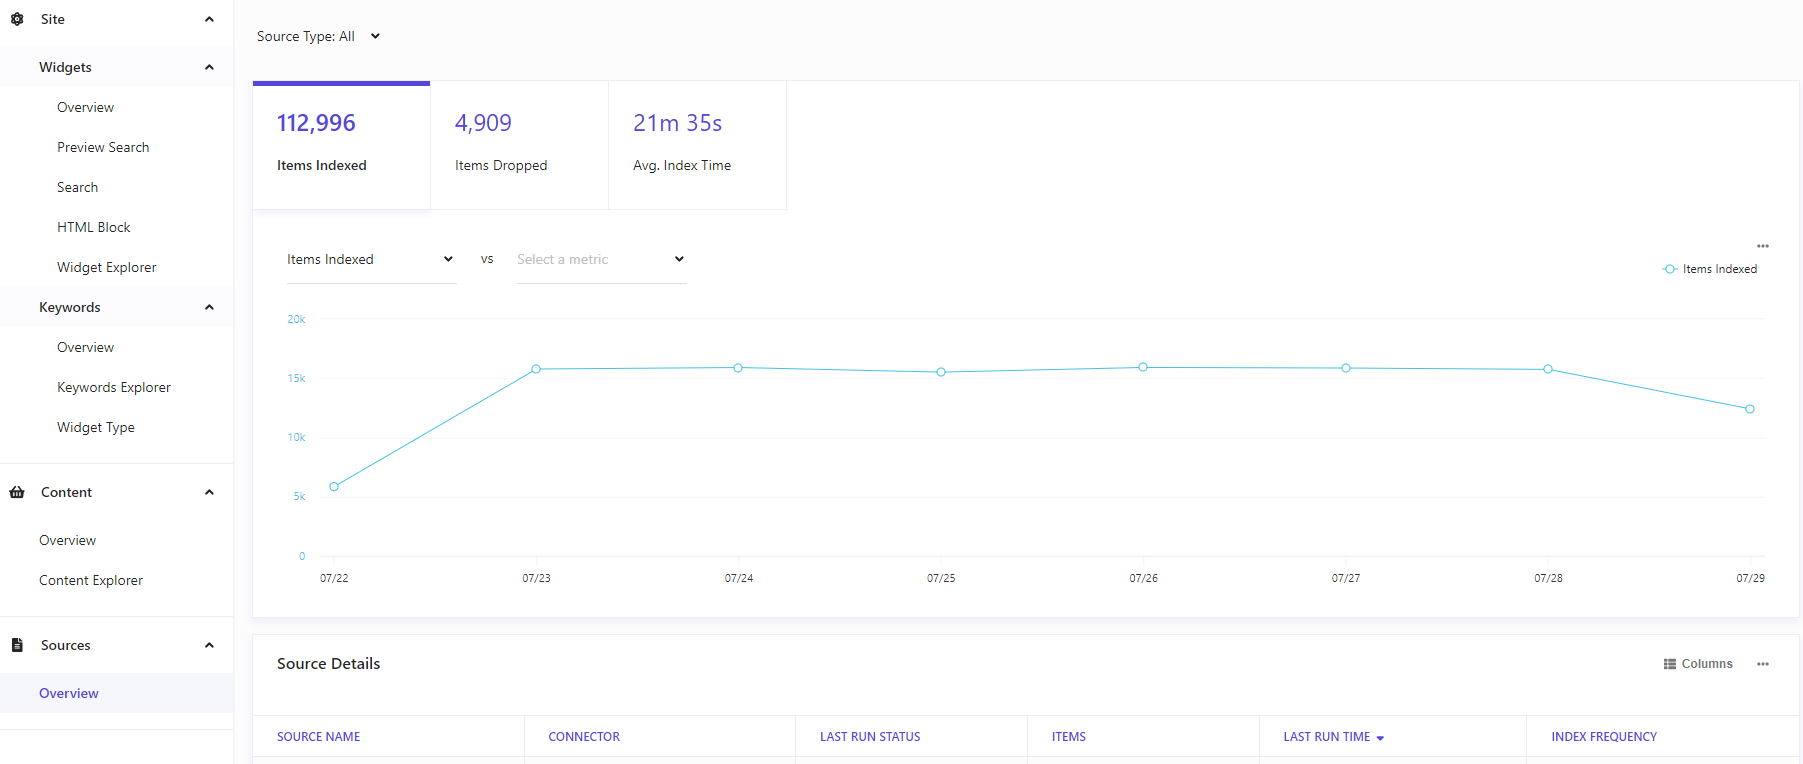
This report includes important metrics such as:
At the bottom of the report, you’ll find a comparative table that details source-specific information, including index frequency and the status of the last run (whether it finished successfully or failed). This data is crucial for identifying any issues that may affect the indexing process.
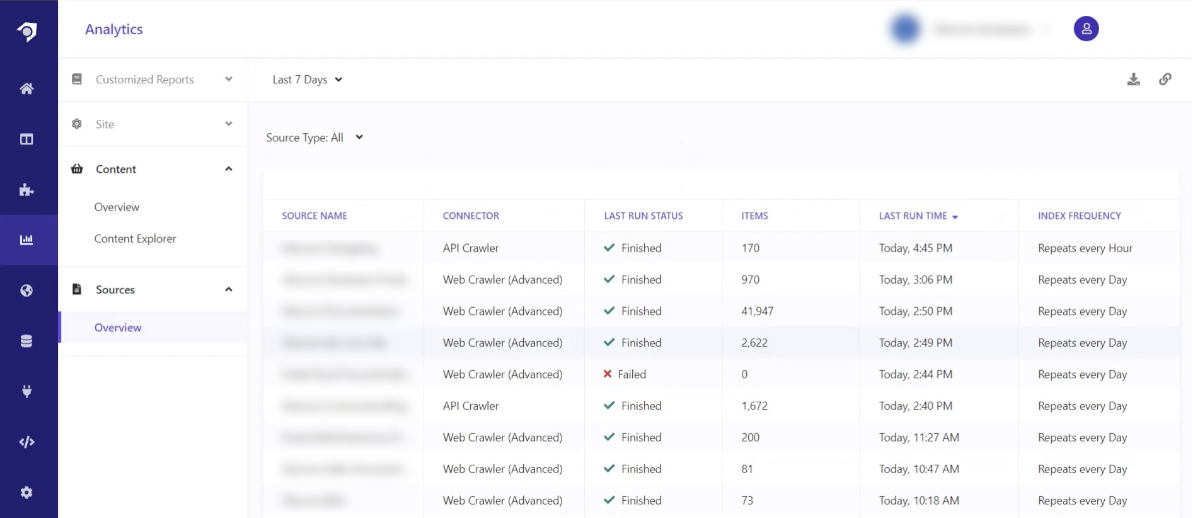
You can also apply filters to the Sources Overview Report to refine your analysis. Available filters include:
By utilizing the Sources Overview Report, you can gain a clearer understanding of how well your sources are performing and make informed decisions to optimize your indexing processes.
Sitecore Search Analytics provides invaluable insights that empower you to optimize your website’s search functionality and enhance user engagement. By leveraging the diverse reports available—whether analyzing widget performance, keyword effectiveness, or source metrics—you can make informed decisions that drive conversions and improve the overall user experience. Understanding these metrics allows you to identify strengths and weaknesses in your search implementation, enabling continuous refinement of your strategies. As you use these tools and insights, you’ll be well-equipped to create a more effective and responsive search environment, ultimately leading to greater satisfaction for your visitors and increased success for your organization.
Until next time, happy reporting!