Why Determining Your Support Team’s Value Matters
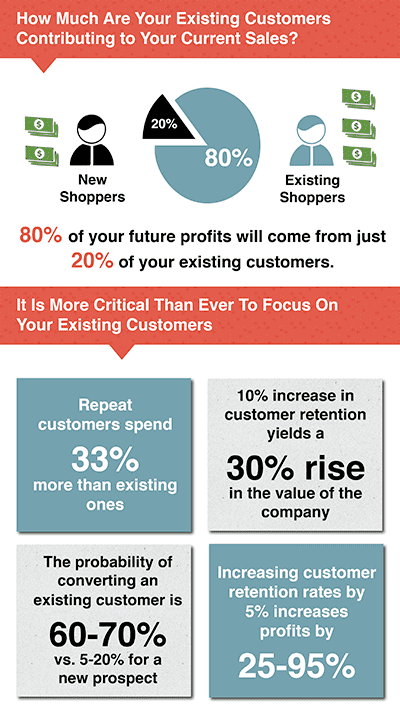
Did you know businesses with effective support teams experience 89% higher customer retention rates? And that it can cost up to 5-25x more expensive to get new customers than to retain them!
Unfortunately, many companies view support and CX as a cost center, rather than a value driver, making it crucial to quantify and communicate its impact. The truth is that happy customers mean successful businesses and you cannot have happy customers without a strong support team.
To determine your team’s value, there are a number of different strategies you can employ. We’ll go over different metrics and sources to consider when calculating support value, qualitative contributions like customer satisfaction and loyalty, and steps to align the team’s value with your organization’s goals.
It can seem like an insurmountable task, so remember to break it into chunks and the first time you do this will be the most difficult as you need to gather all of the data. Once it’s in one place, it’s much easier to maintain.
https://www.revechat.com/blog/customer-service-kpi/
Quantifying the Value of Your Support Team
The most obvious way to quantify things is revenue. What direct revenue impact does your team have? Let’s go over some examples.
Upselling and Cross-selling
Are your support interactions directly leading to upsell and cross selling? If so, that revenue is value you can add to your bottom line. And truth be told, there may be no one better to offer those upsell and cross-sell opportunities than your support team as they are on the front lines and can make informed product recommendations for what your customers really need.
A simple formula you can use to determine your revenue per interaction is:
Revenue from upsells ÷ Total support interactions = Average revenue per interaction.
Retention Revenue
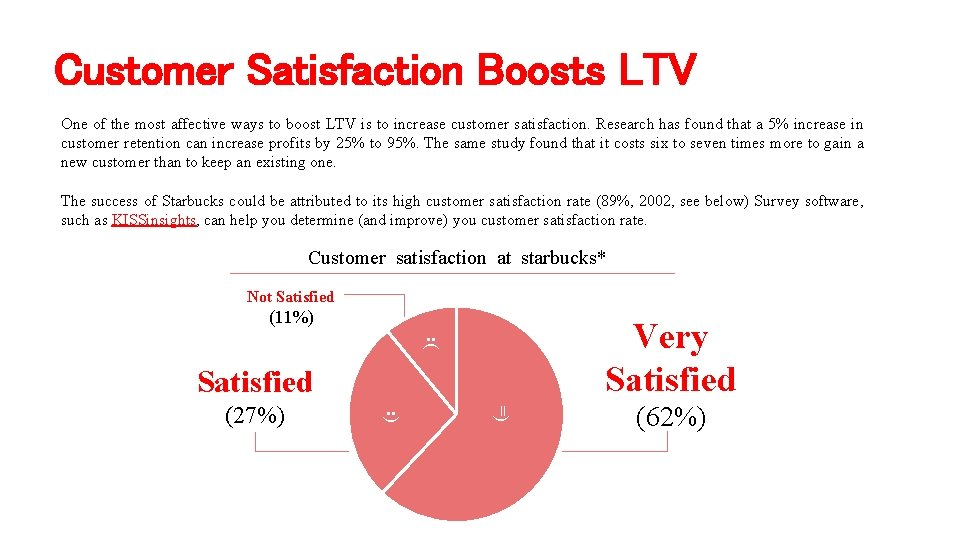
What is the LTV (Lifetime Value) of customers retained due to exceptional support? Or conversely, what is the cost of not offering world-class support? Happier customers mean customers that stay with a company longer and this means more money for the business. Support is a direct line to reducing churn as if customers are unhappy or have a critical issue, front line support is typically the first place to hear it and can help turn this around with exceptional support.
A simple formula for Customer Lifetime Value is:
Average Dollar amount of purchase or upsells x number of customer purchases per year x average length of the customer relationship in years = Customer LTV
https://slidetodoc.com/starbucks-clv-calculation-case-study-case-study-starbucks/#google_vignette
First Call Resolution
Imagine if every ticket took 20 emails back and forth to solve? That is definitely possible for some, but not all. You can get immense value by solving issues in the first call (First Call Resolution - FCR). This limits potentially needless touchpoints and allows customers get quick results and for your agents to move on to other tickets.
Self Service Enablement
What’s better than First Call Resolution? Zero Call Resolution! That’s not really a stat, but it should be, as effective self-service will save you time and money and do the same for your customers!
A well designed FAQ, intuitive chatbots and a robust Help Center can be all you need to help more customers and save your company a ton on time and money! Buffer simply revamped their page and ended up reducing costs by 26%!
A formula to help here is:
Tickets avoided via self-service ÷ Total Tickets = Percentage of cost savings
How to Measure Impact on Customer Satisfaction and Loyalty
This is perhaps easier said than done, but there are several metrics you can use to come up with some numbers to measure these seemingly unquantifiable metrics.
Customer Satisfaction Scores (CSAT)
CSAT scores are a direct reflection of the effectiveness of your support team. If customers are happy and reflect this in their CSAT surveys, then that shows how valuable your team is. Higher CSAT scores correlate with increased customer loyalty which means reduced churn and increased repeat purchases!
Net Promoter Score (NPS)
This metric simply is a reflection of how likely your customers are to recommend your brand to someone else. The higher this is, the more satisfied they are with your products and service and the more likely they are to keep coming back and bring their friends with them! This means that the more we flex our human attributes, such as empathy, curiosity and care, our customers will feel supported and heard and result in improved brand perception.
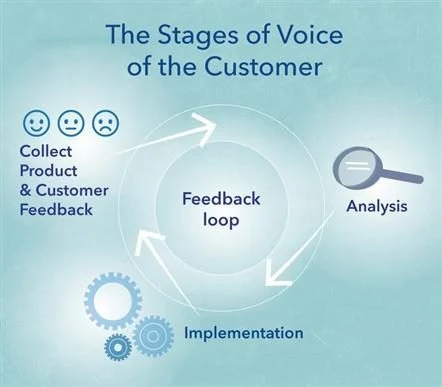
Voice of the Customer (VoC)
VoC isn’t one metric, rather it’s a program that collects any and all qualitative feedback to highlight how support impacts customer experiences, perceptions of the brand and product feedback too. It’s exactly what it sounds like, it gives a voice to your customers so they are heard and their feedback is actioned. If you don’t already have one, a VoC program is essential to capturing these details, and while capturing them is important, the most important part is to actually action this feedback.
Other Ways to Highlight Support Team Efficiency and Productivity
But wait! There are even more ways you can quantify your teams involvement and impact. Some of these are a little more simple, but can be very helpful in quantifying everything your team does.
- Ticket Volume Handled: Total tickets resolved per agent and per team
- Average Response Time: Faster responses lead to better customer experiences and could increase revenue by 2%.
- Cost Per Ticket: Highlights the balance between cost efficiency and maintaining high service quality.
- Does your team handle 1:1 customer issues? 1 to many or both?
- There is different value you can attribute to each so be sure to keep this in mind. For example if you have one agent who deals with ten $1 million clients, that is different than someone who deals with 1000 $100 clients.
- Who are the common stakeholders your team works with?
- This is both internal and external. If your team regularly deals with C-Suite execs and helps them, then the team’s value is much more. From a business level though, if you count time somewhere for one group, make sure it’s offset or accounted for with the other group.
- Is there public scrutiny of your teams’ work?
- If they make a mistake, is Forbes going to pick it up? If so, then there is a greater risk and therefore greater value for the job to be done right.
Creating an Internal Support Value Dashboard
When I was first tasked with finding the value of our Support team, I had to do it from scratch, which was much more difficult and frankly annoying, than if the team had a Support Value Dashboard already created.
A visual dashboard is a fantastic resource that can be regularly updated and shown to key stakeholders to exemplify the value that your team is already displaying. This is a big selling feature to get Exec buy-in for future hiring or budget increases too!
How to create a dashboard is a bit out of scope for this article, however, there are a few key things you’ll want to include at least all of the metrics and points we’ve discussed already here. It’s also a good idea to add visuals so stakeholders can easily digest and understand the impact of your team. Pie charts, bar graphs, and trend lines are good ones to show growth statically, and over time.
Tie Support Value Back to the Organization Goals
It’s all well and good if you come up with a number to demonstrate the value of your team, but it’s a moot point if you can’t communicate that value back to key stakeholders AND show what it actually means to them and the organization. Here’s a hint, most execs have to worry about bottom line to some degree, so tie it back to the businesses growth and revenue as a starting point.
You can do this by showing how all of those amazing first touch response tickets are saving them X dollars over the year. And that by taking X more dollars to build a robust help center, they’ll actually save Y by having customers use more self serve options. Break it down so it demonstrates revenue growth or cost optimization.
From there, you want to work to prove that Support is not a cost center as many folks believe, but rather a value driver. Position Support as a strategic partner in achieving customer-centric goals, not as a stand-alone silo.
For example, here at Fishtank Consulting, our clients can sometimes move around between support requests and larger project work. By having a cohesive experience, clear expectations, and a Support goal that always works towards the business goals, we make sure that clients and the business stakeholders are happy and cared for. We aim for 100% CSAT and regularly hit this, which translates to reduced churn and increased customer loyalty!
So How Do You Come Up With a Final Number?
Let’s go over an example to show you how you can arrive at a result to present to key stakeholders. Keep in mind, it’s not simply going to them and saying “Our Support team’s value is X dollars.” It’s more nuanced than that and you will want to demonstrate the revenue you bring in, or can bring in (for future forecasting), and also any savings (cost optimizations) you are bringing to the business. Not every aspect of the example below will apply for every situation so keep that in mind as you work on your numbers.
Step 1: Quantify Revenue Impact
Upselling and Cross-Selling
Your team handled 5,000 interactions last year, and 300 of those interactions resulted in successful upsells, generating $150,000 in additional revenue.
Formula: Revenue per Interaction = $150,000 ÷ 5,000 interactions = $30 per interaction.
Retention Revenue
Imagine your average customer’s Lifetime Value (LTV) is $10,000 (discussed above), and your support team retained 50 customers last year through exceptional service.
Formula: Retention Revenue = 50 customers x $10,000 LTV = $500,000 in saved revenue.
Together, upselling and retention contributed $650,000 to your bottom line.
Step 2: Calculate Cost Savings through Efficiency
First Call Resolution (FCR)
High FCR rates save time and reduce the need for repetitive touchpoints. If your team resolved 70% of 12,000 annual tickets on the first contact:
Formula: Cost Savings from FCR = 70% of 12,000 = 8,400 tickets resolved without escalation.
Assume each resolved escalation saves $15 in operational costs:
Cost Savings = 8,400 x $15 = $126,000.
Self-Service Enablement
Your team revamped the Help Center, leading to a 30% reduction in ticket volume. So let’s say that means your team had 12,000 tickets last year, and self-service prevented 3,600 tickets.
Formula: Cost Savings = 3,600 tickets avoided x $10 average ticket cost = $36,000 saved.
Step 3: Evaluate Customer Satisfaction Metrics
CSAT and NPS
Your team maintains a 95% CSAT score and an NPS of 80, highlighting strong customer loyalty. Based on industry benchmarks, higher NPS scores correlate to a 20% increase in repeat purchases which generated $1M last year.
Projected Increase: $1M x 20% = $200,000 in potential future revenue growth.
Voice of the Customer (VoC)
Your VoC program identified product issues leading to a 15% reduction in churn for 100 high-value customers. Each of these customers has an LTV of $15,000.
Formula: Saved Revenue = 15% x 100 customers x $15,000 LTV = $225,000.
Step 4: Showcase Productivity and Efficiency Metrics
Ticket Volume and Cost Per Ticket
Your team resolved 12,000 tickets last year at an average cost of $8 per ticket. This cost efficiency underscores your ability to maintain high service quality while keeping expenses low.
Average Response Time
Your team reduced response times from 12 hours to 4 hours, leading to a 2% increase in revenue through improved customer experiences.
Scenario: Your annual revenue is $5M.
Formula: Revenue Impact = $5M x 2% = $100,000.
Step 5: Build the Story for Stakeholders
When presenting these numbers, tell the story that ties them back to organizational goals. For example:
Revenue Growth:
“Our support team contributed $1,111,000 in direct revenue through upselling, retention, and repeat purchases.”
Cost Optimization:
“We saved $162,000 by improving first call resolution and enabling self-service.”
Strategic Alignment:
“By improving CSAT to 95% and reducing churn, our team reduced customer loss while positioning the company for future growth.”
Step 6: Visualize the Impact with a Dashboard
Present these metrics through clear visuals, such as:
- Pie Chart: Breakdown of revenue sources (upselling, retention, self-service).
- Bar Graph: Year-over-year improvements in ticket volume, FCR, and response time.
- Trend Line: CSAT and NPS growth over time, with revenue correlation.
Tell a Story that Turns Support from a Cost Center to a Value Driver
By now, it should be clear that you’ll almost always want to know the value of your support team. There are lots of different metrics and methods you can use to come up with something, but one of the biggest things is to always tie back into the business goals. Show how your team is increasing revenue and optimizing costs. Measure your customer satisfaction rates, retention rates, churn rates and more. Find a cost per ticket that highlights efficiency, productivity and qualitative contributions.
Track the numbers, build a dashboard and tell a story. The numbers always tell a story, but it’s up to you to make sure you tell that story in a way that makes your team indispensable and a value driver, not a cost center.